Lab 7: Monitoring the Application Network
Overview
High availability of applications is critical for every business. The evolution of only running monolithic applications on a mainframe server, to adding in the use of cloud-based applications and services, has added tremendous flexibility, and complexity, to an Application Network.
Businesses need to design their Application Network for scaling and redundancy, as well as being able to closely monitor their Application Network to use high availabilty is essential.
Security must, of course, be maintained. The Life Sciences industry has very strict standards with regard to protecting Sensitive Personal Information (SPI). Monitoring for, and protecting against, intrusions into an Application Network must be a part of any Application Network.
Learning Objectives
-
Review the features of Anypoint Visualizer.
-
Review the features of Anypoint Monitoring.
Step 1: Anypoint Visualizer
-
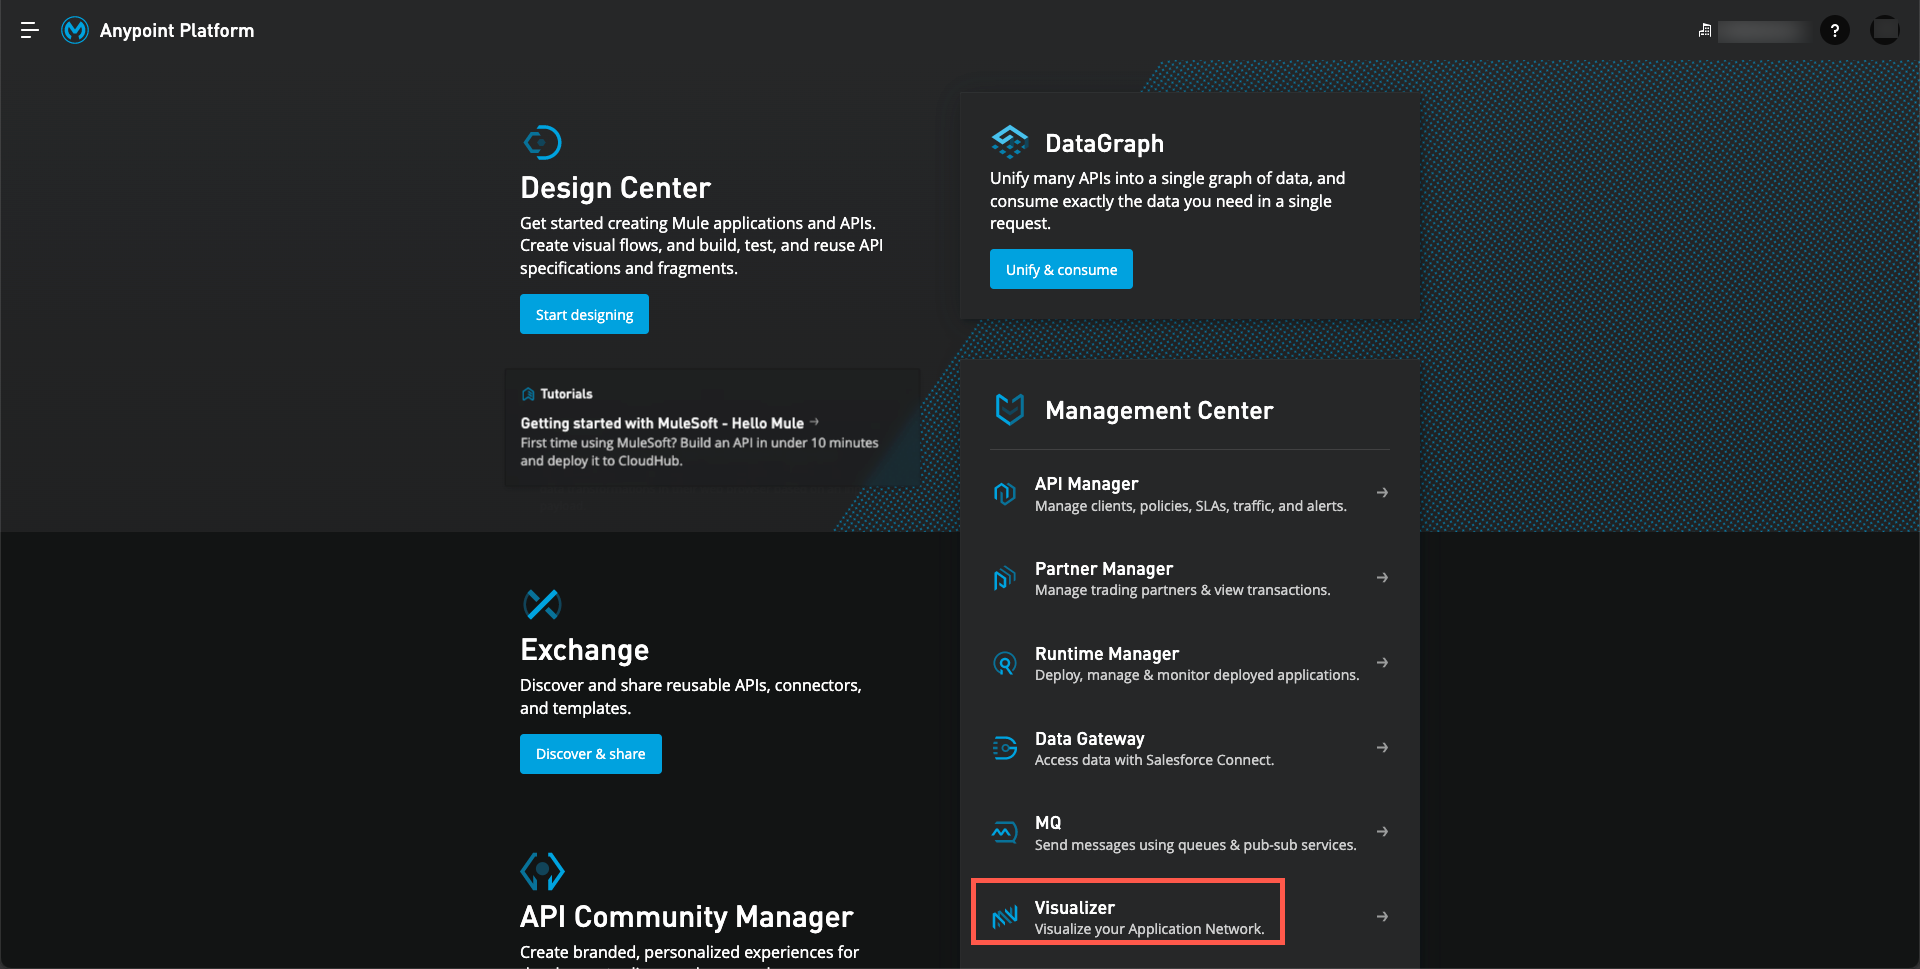
Click on the hamburger menu in the upper left corner and select Visualizer.
-
You may be presented with a pre-configured view of Visualizer. You may make selected changes to this view, however some features will not be enabled for your userid. Anypoint Access Management may be used to authorize users to tailor the own dashboards.
Note: The page may not be populated initially. If not, complete the following steps to populate the display:
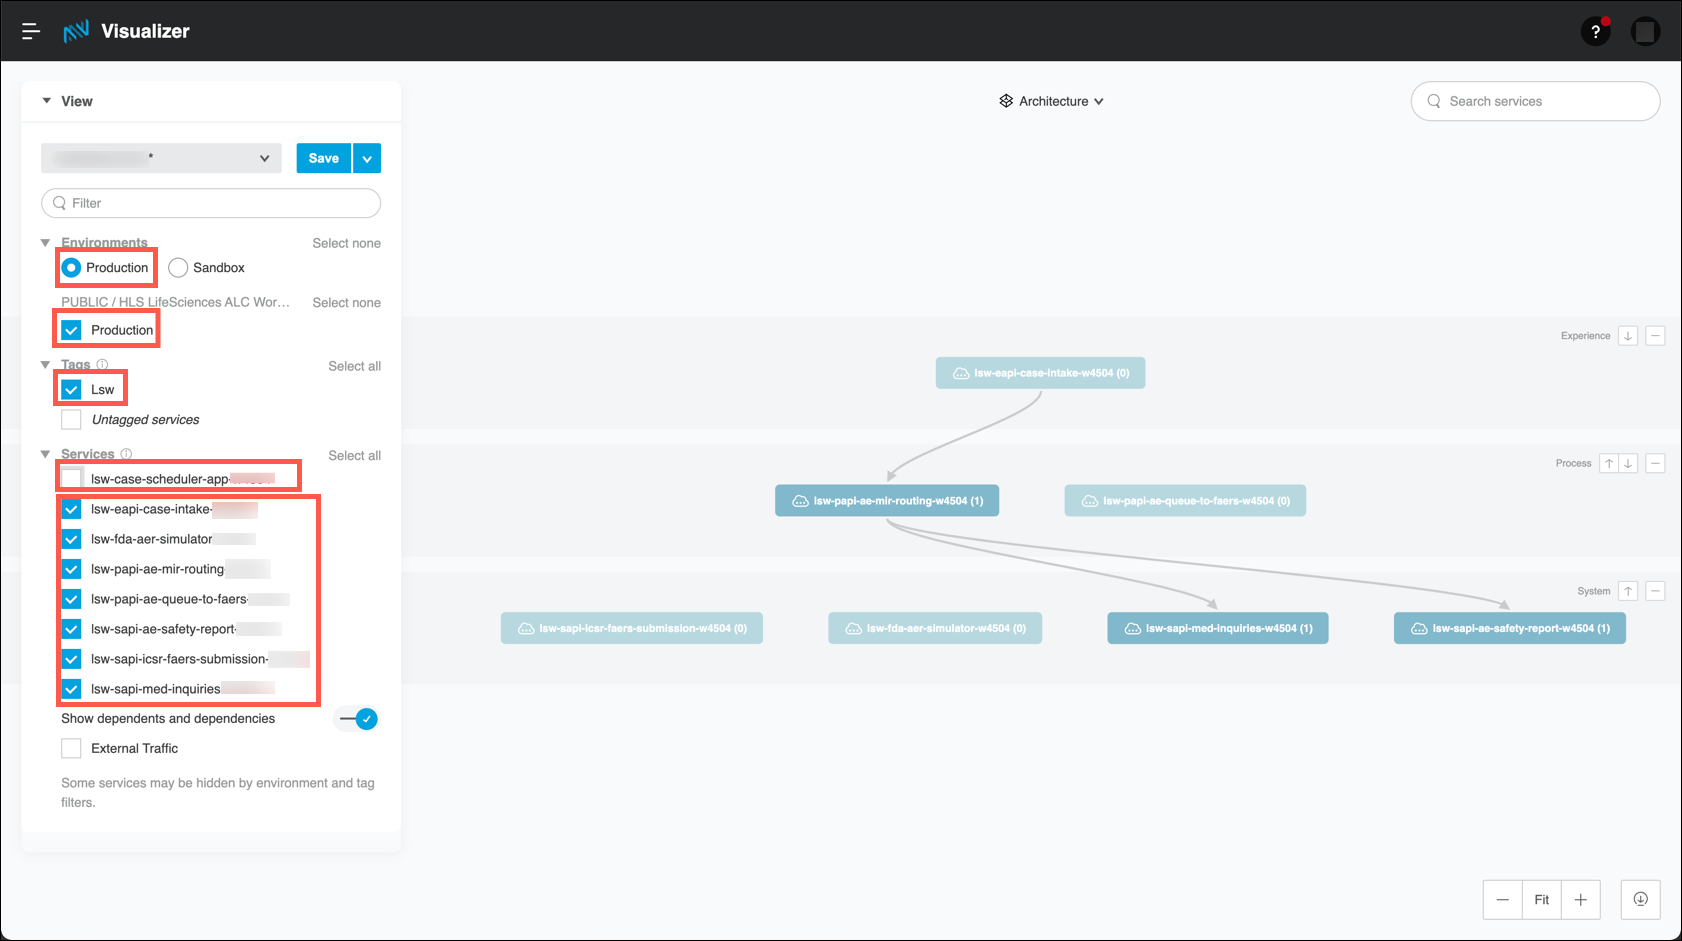
1. Expand the Environments section, click on the Sandbox radio button.
2. Select the Sandbox check box associated with the Business group that is listed.
3. Expand the Tags section and then select the Lsw check box.
4. Select each of the check boxes under the Services section.
5. Uncheck the lsw-case-scheduler-app API.
6. Click on the Save button to save your layout.
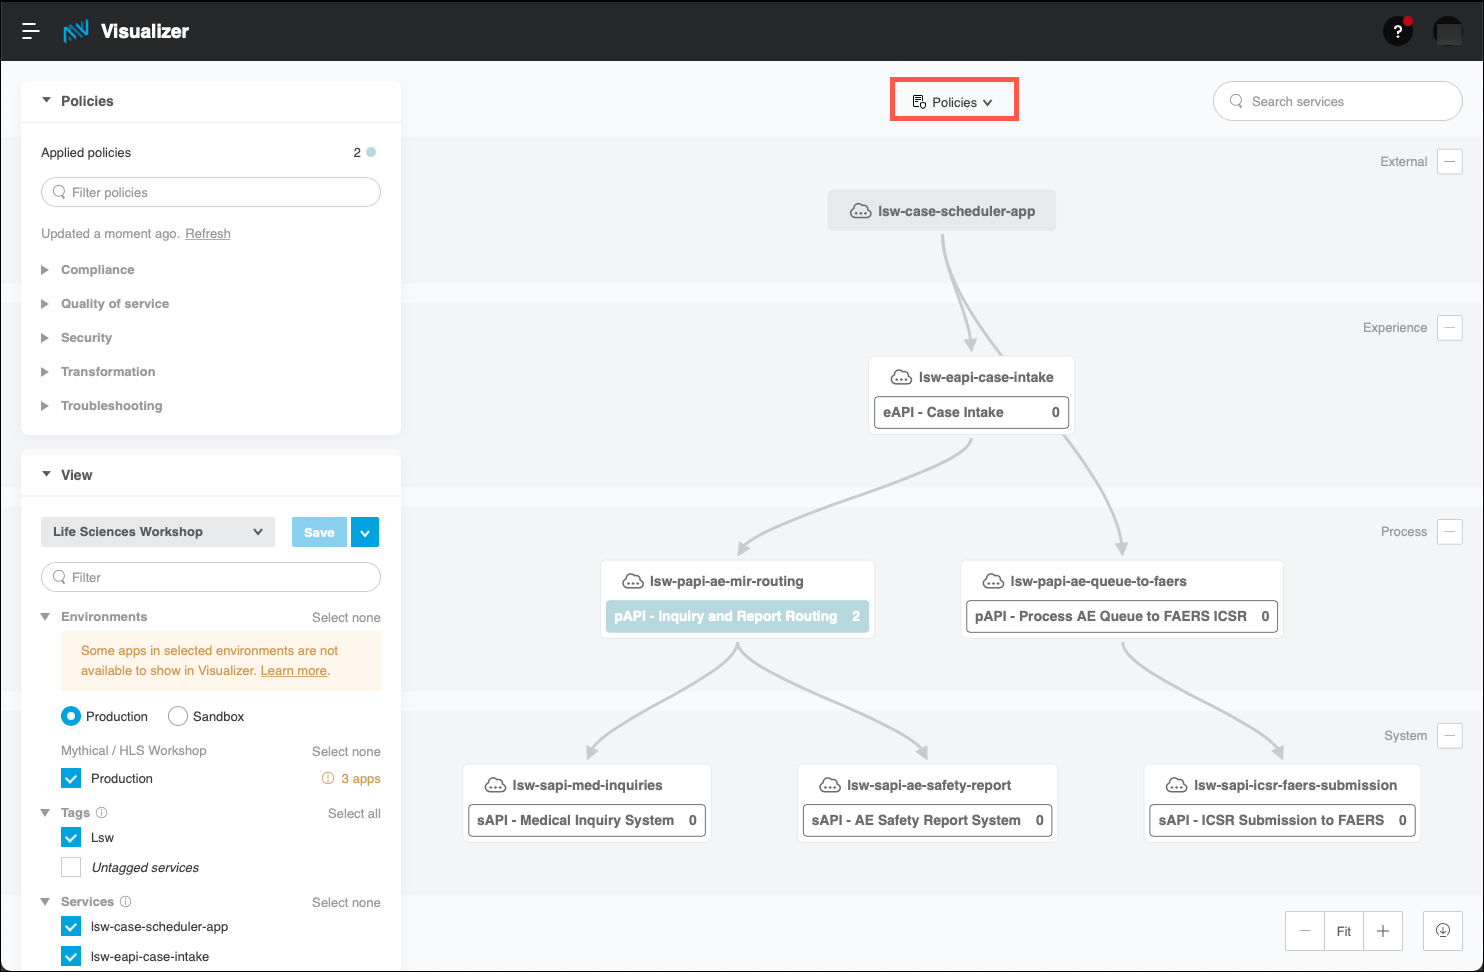
The page will now display just the APIs that are used for this workshop.
-
The layout of this view is designed to represent the Application Network for this workshop. Anypoint Visualizer provides a graphical view of the APIs that are of interest to you. In this example, you are viewing only those APIs that are used in this workshop. There could be many more in your runtime environment. Anypoint Visualizer allows you to focus on just the APIs that are of interest.
Note: Note the API layers that are labeled on the right of the page. You can add labels to your APIs to indicate where in your API Led architecture the APIs are targeted. Also, there may be an API named lsw-case-secheduler-app listed in the External layer. This API is used to periodically invoke the APIs used in this workshop in order to "light up" the monitoring pages. (APIs will only appear if they have been invoked within the last 7 days.) The lsw-case-secheduler-app is not an integral part of the Application Network.
Also note the connecting lines between the APIs. The connections between APIs are based on traffic between applications or APIs that has occurred in the last seven days. If an application appears in multiple workers, they appear as two distinct nodes in the graph.
Anypoint Visualizer collects data from Mule applications, APIs, and proxies deployed to CloudHub; from standalone Mule runtime engines (Mule instances); or from Runtime Fabric, to discover all incoming and outgoing connections through an embedded plugin. As long as the application, API, or proxy is running on a supported Mule instance, it is discovered along with any associated dependencies.
If authorized, you can create one or more views to show the APIs that you are currently interested in. Note also on the left side of the page how you can tailor which Environment and APIs you would like displayed. APIs can be tagged and then filtered to give even more options to display APIs of interest.
-
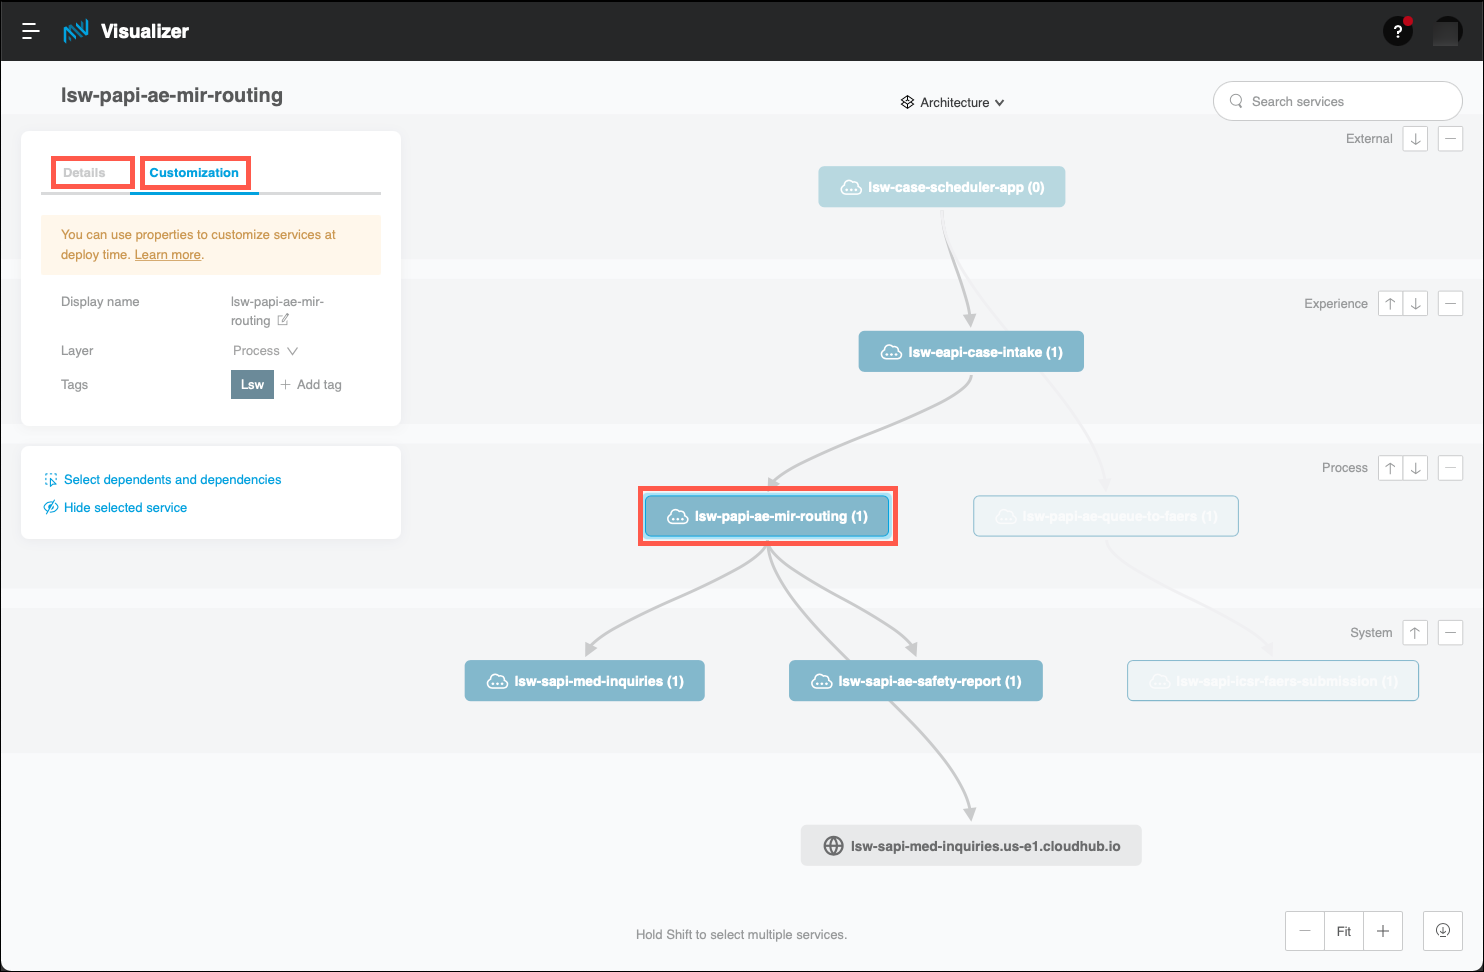
Review the various features supported by Anypoint Visualizer. Start by clicking on the lsw-papi-ae-mir-routing API. Note that authorized users can customize the displayed name of the API as well as assign the API to a different layer in the display. Also, note how focus has been set to those APIs that either call, or are called by, the lsw-papi-ae-mir-routing API.
Click on the Details tab.
-
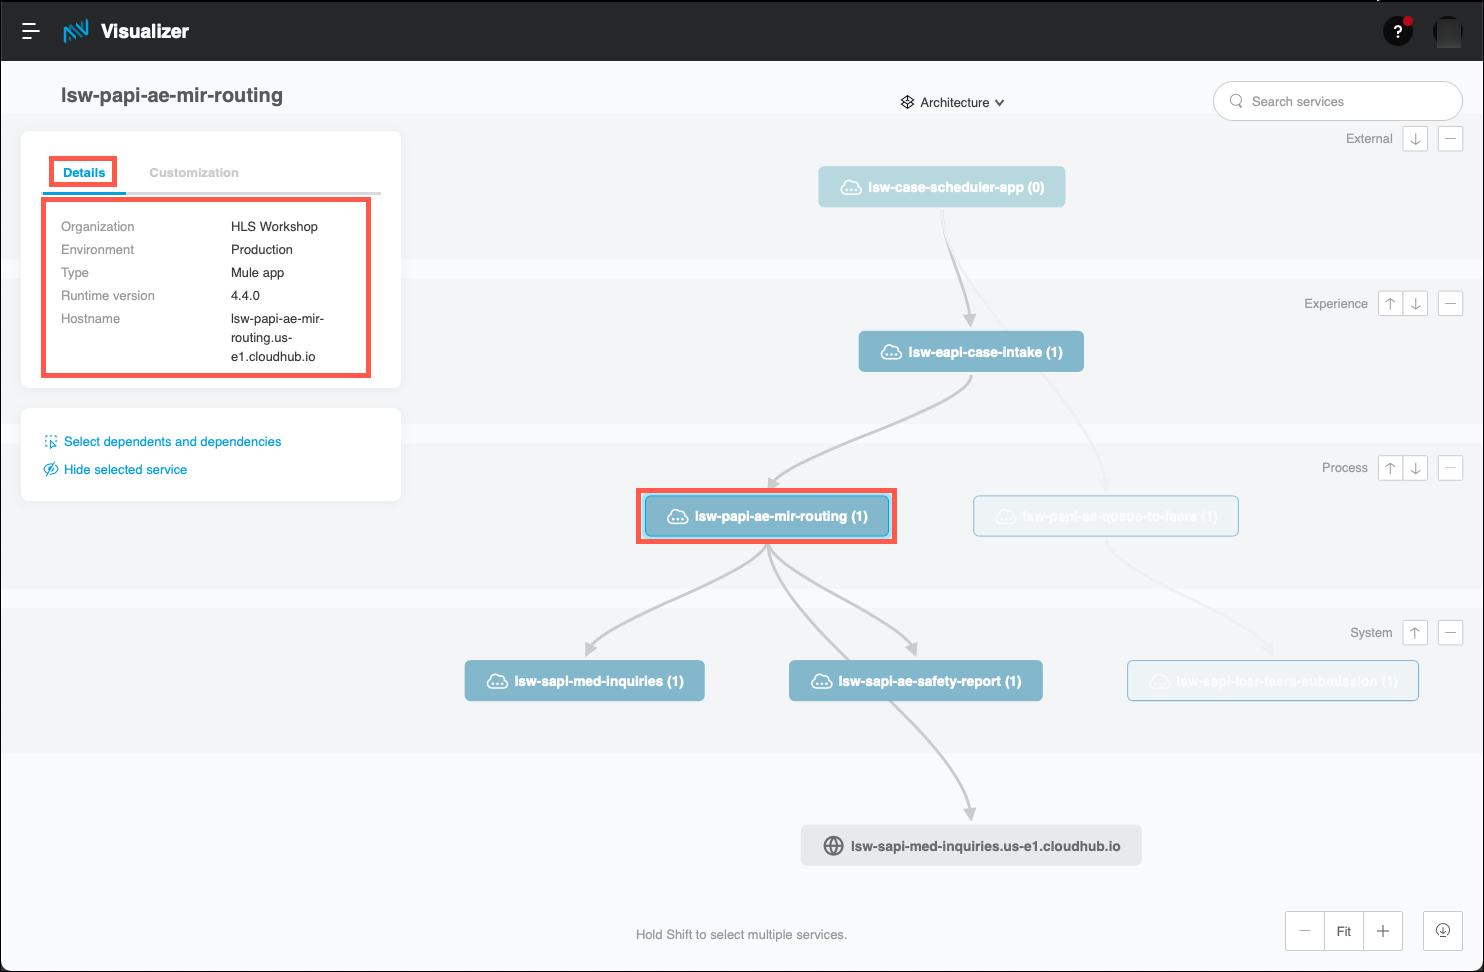
The runtime details associated with the API are now displayed.
-
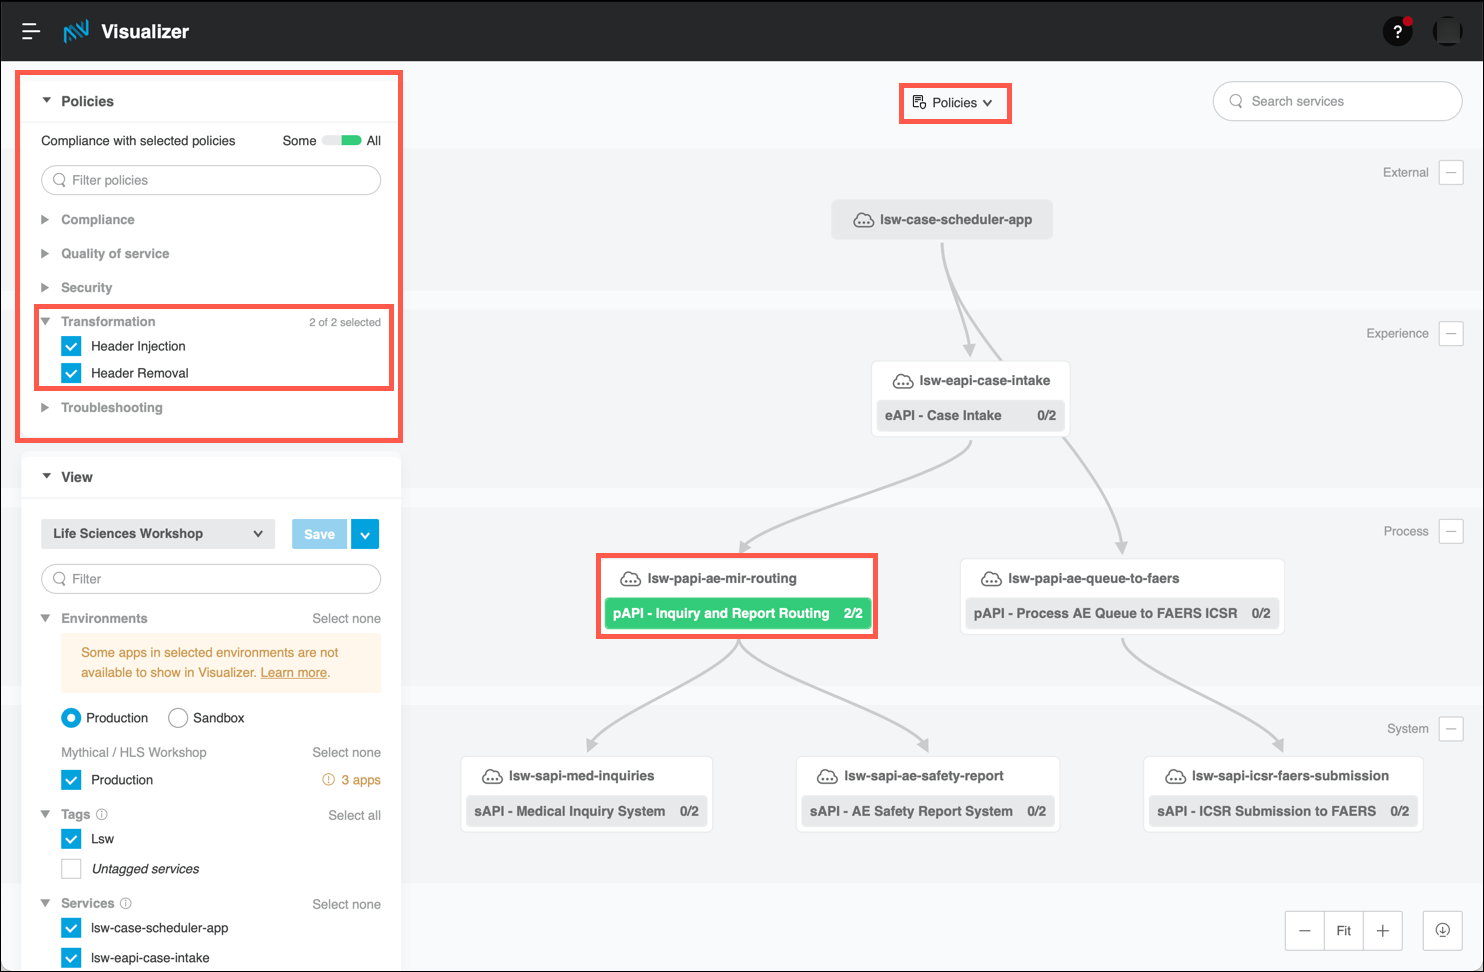
So, from the Architecture page you are able to see a lot of static data regarding an API. To see information regarding any API policies that may be in place for your APIs select the Policies page.
Note: Configuring API policies is out of scope for this workshop. Thus, the screen captures for the Policies page will not match what you will see in your workshop instance.
-
On the left side of the page you have options to filter the display of API policies by various categories of policies. You can also display all API policies that are in place for a specific API by clicking on the API in the diagram. Note that in the screen capture you can see that a filter has been set for Header Injection and Header Removal policies, and that the lsw-papi-ae-mir-routing API is highlighted, indicating that those policies are in effect for that API.
-
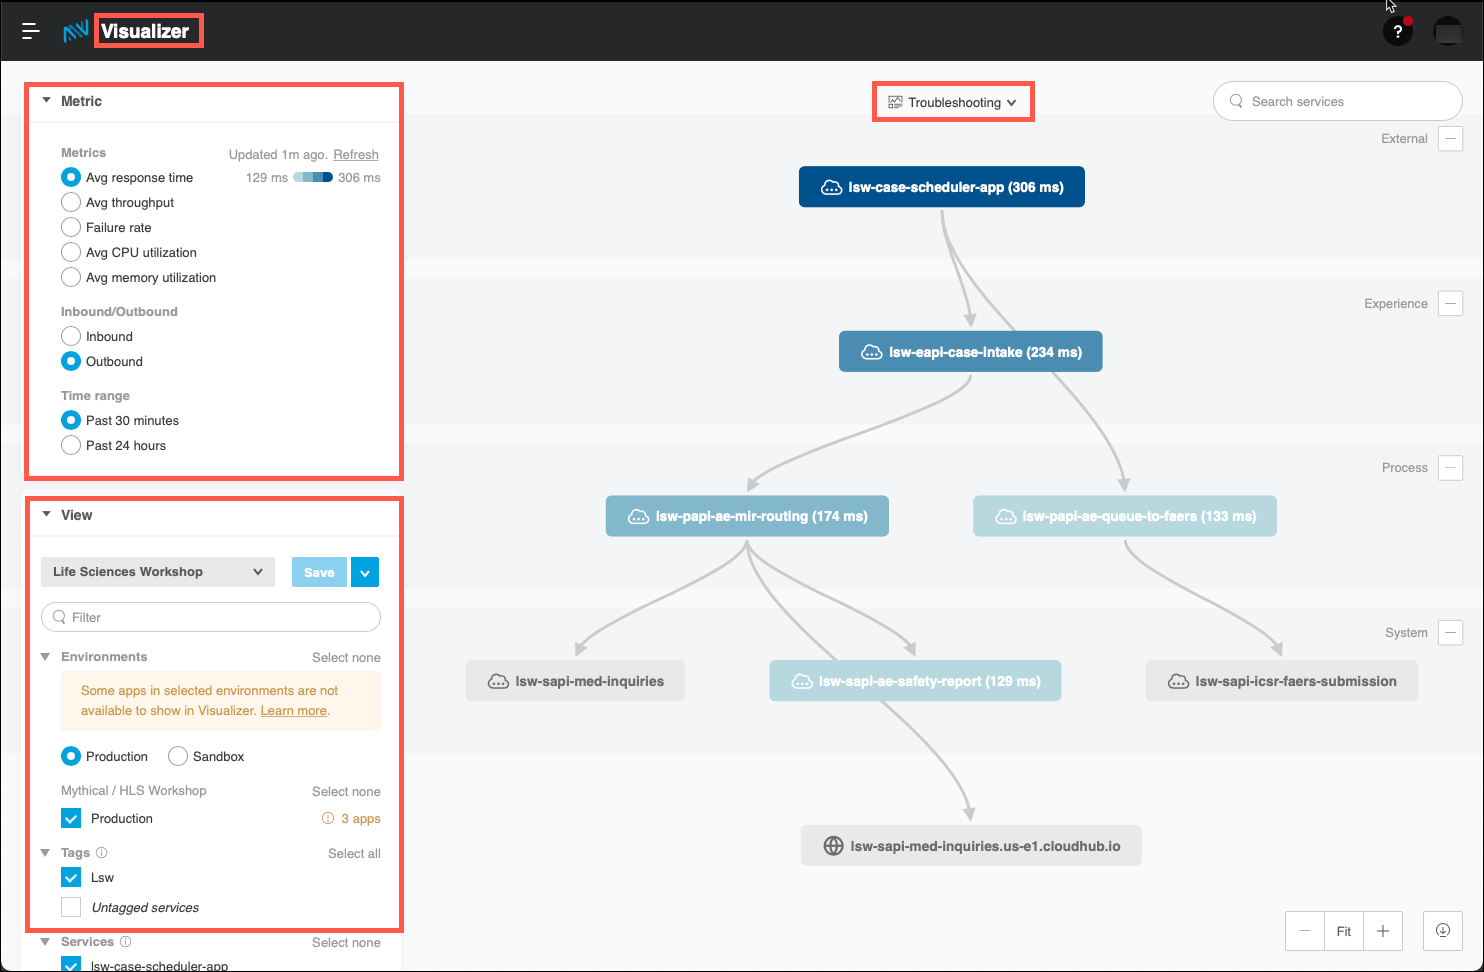
Next, if you would like to see dynamic metrics that show the current status of your Application Network, switch to the Troubleshooting page, then click on the Visualizer title bar to view metrics for all APIs currently displayed.
-
The Troubleshooting page provides a number of different options to display the status of your Application Network. Like the Architecture and Policies pages, you have the ability to use the View section to control which APIs you want displayed. This page includes a Metric section, which is used to enable you to view various metrics for your APIs.
Try clicking on various metrics to see how the display changes. Additional details are available for each of the APIs that are displayed.
-
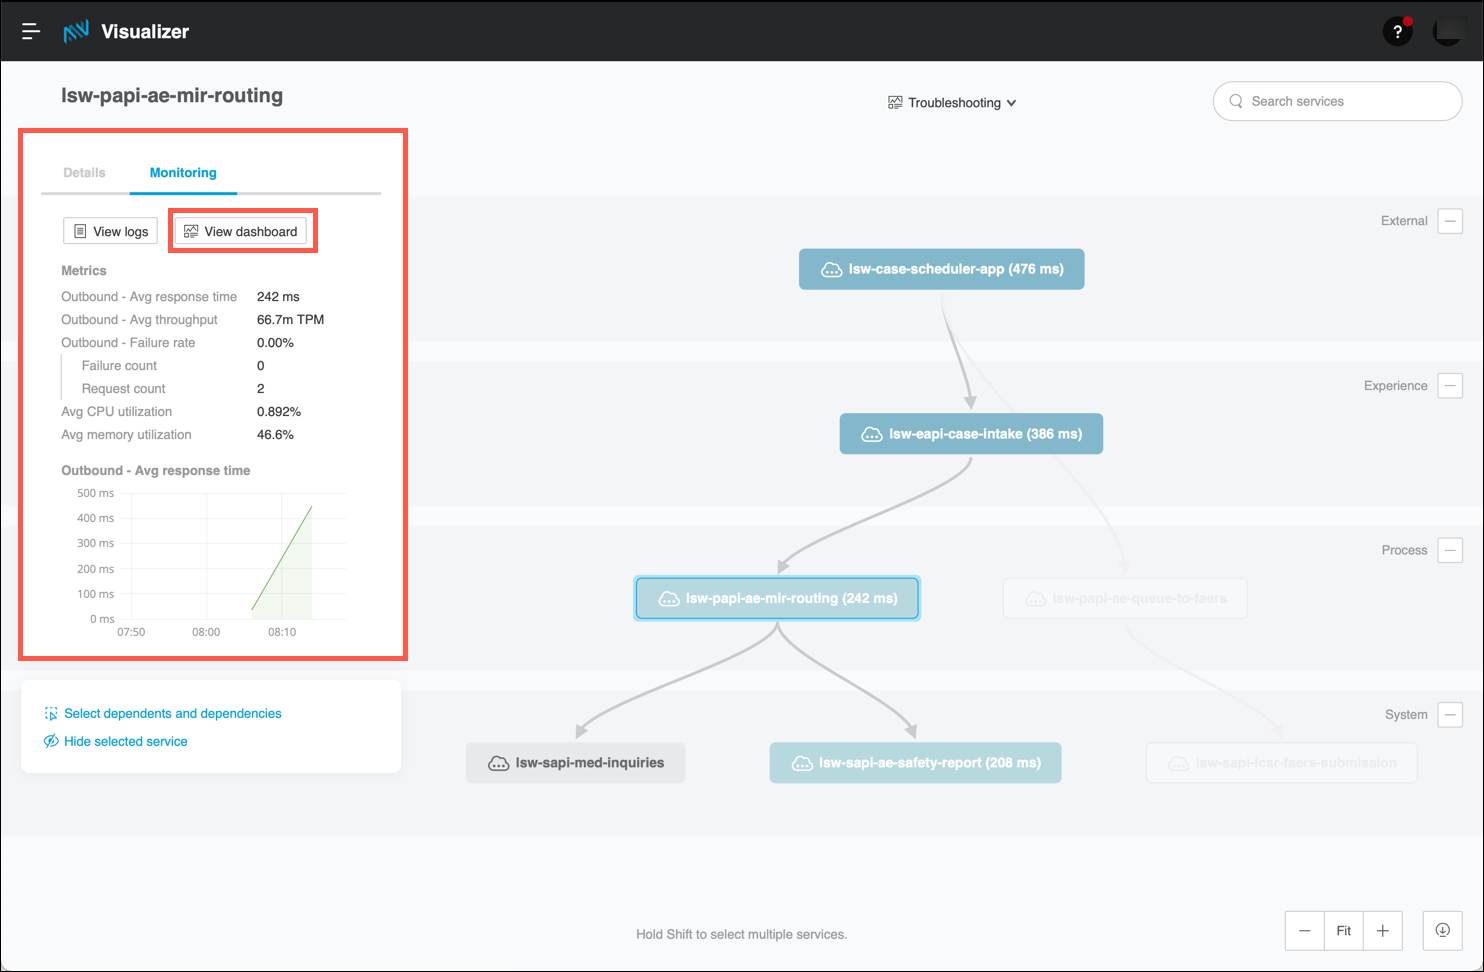
Click on the lsw-papi-ae-mir-routing API.
-
The Monitoring tab will appear in the left side of the page. Here you can see metrics at the individual API level. Note that there are also two buttons that you can use to view the logs for the selected API and to switch to Anypoint Monitoring to display a monitoring dashboard for the selected API.
-
Click on the View dashboard button to open the Anypoint Monitoring dashboard. The Anypoint Monitoring dashboard will open in a new browser tab.

Step 2: Anypoint Monitoring
Understanding the state of your infrastructure and systems is important for ensuring the reliability and stability of your services. As part of Anypoint Platform, Anypoint Monitoring provides visibility into integrations across your Application Network. The monitoring tools provide feedback from Mule flows and components in your Application Network.
The monitoring tools are designed to reduce the time to identify and resolve these issues through aggregated metrics, data visualization tools, alerts for issues, and a log aggregation system. Specifically, Anypoint Monitoring provides ways to:
-
Aggregate and map metrics across dependent systems in real-time.
-
Configure dashboards and alerts to reduce the mean time to identification of issues (MTTI).
-
Store and search log data at scale.
Complete the following steps to review the features of Anypoint Monitoring.
-
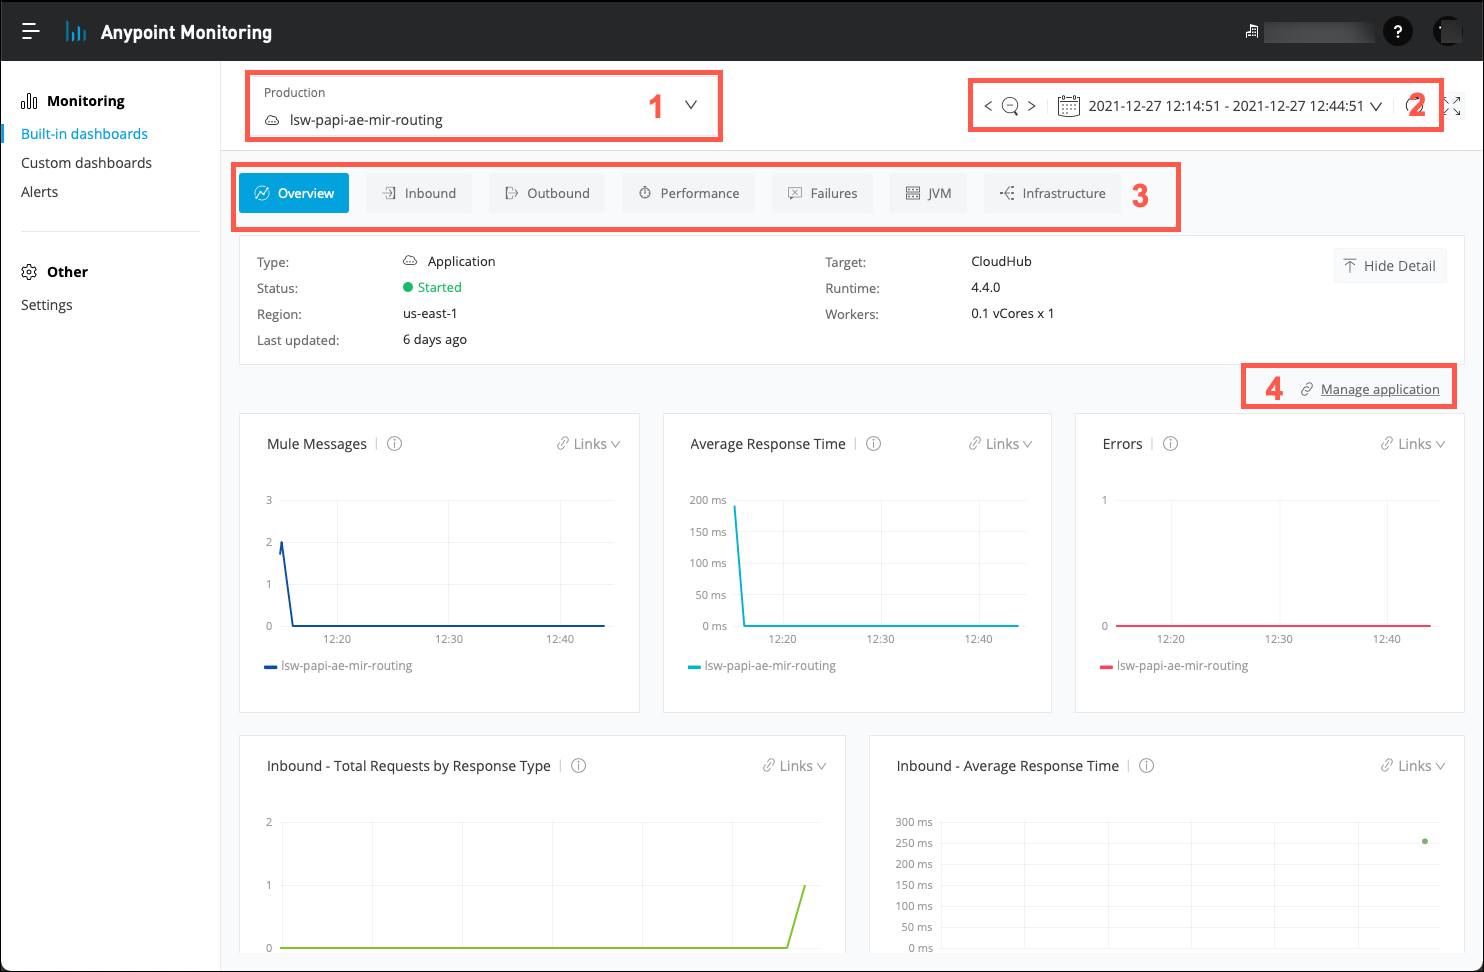
By clicking on the View dashboard button in Anypoint Visualizer your browser should have been opened to the Built-in dashboards page.
-
Ensure that the lsw-papi-ae-mir-routing API is selected in the API Selection drop down list. (1)
-
Note that you can select a time range for the dashboard views. (2)
-
Anypoint Monitoring provides a number of different views in the default dashboard. Review each of the options available in the Tab Bar. (3) Note that each of the tabs may contain graphs and charts that require scrolling to view the entire collection.
-
Click on the Manage application link. (4) Your browser will navigate to the Runtime Manager page for the selected API, where you can view addtional monitoring options.
-
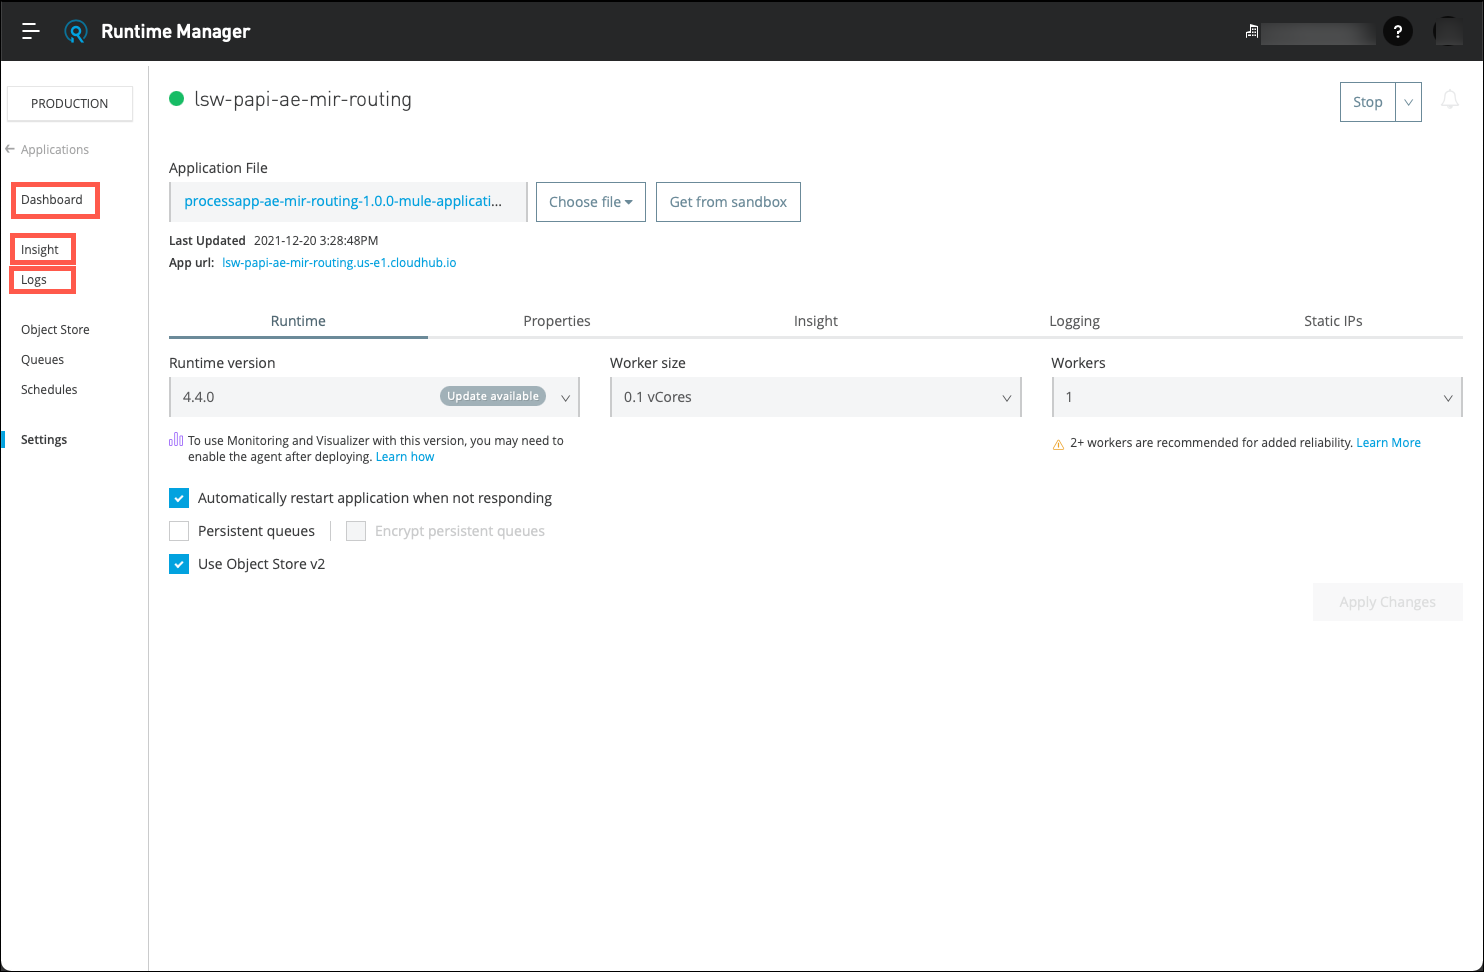
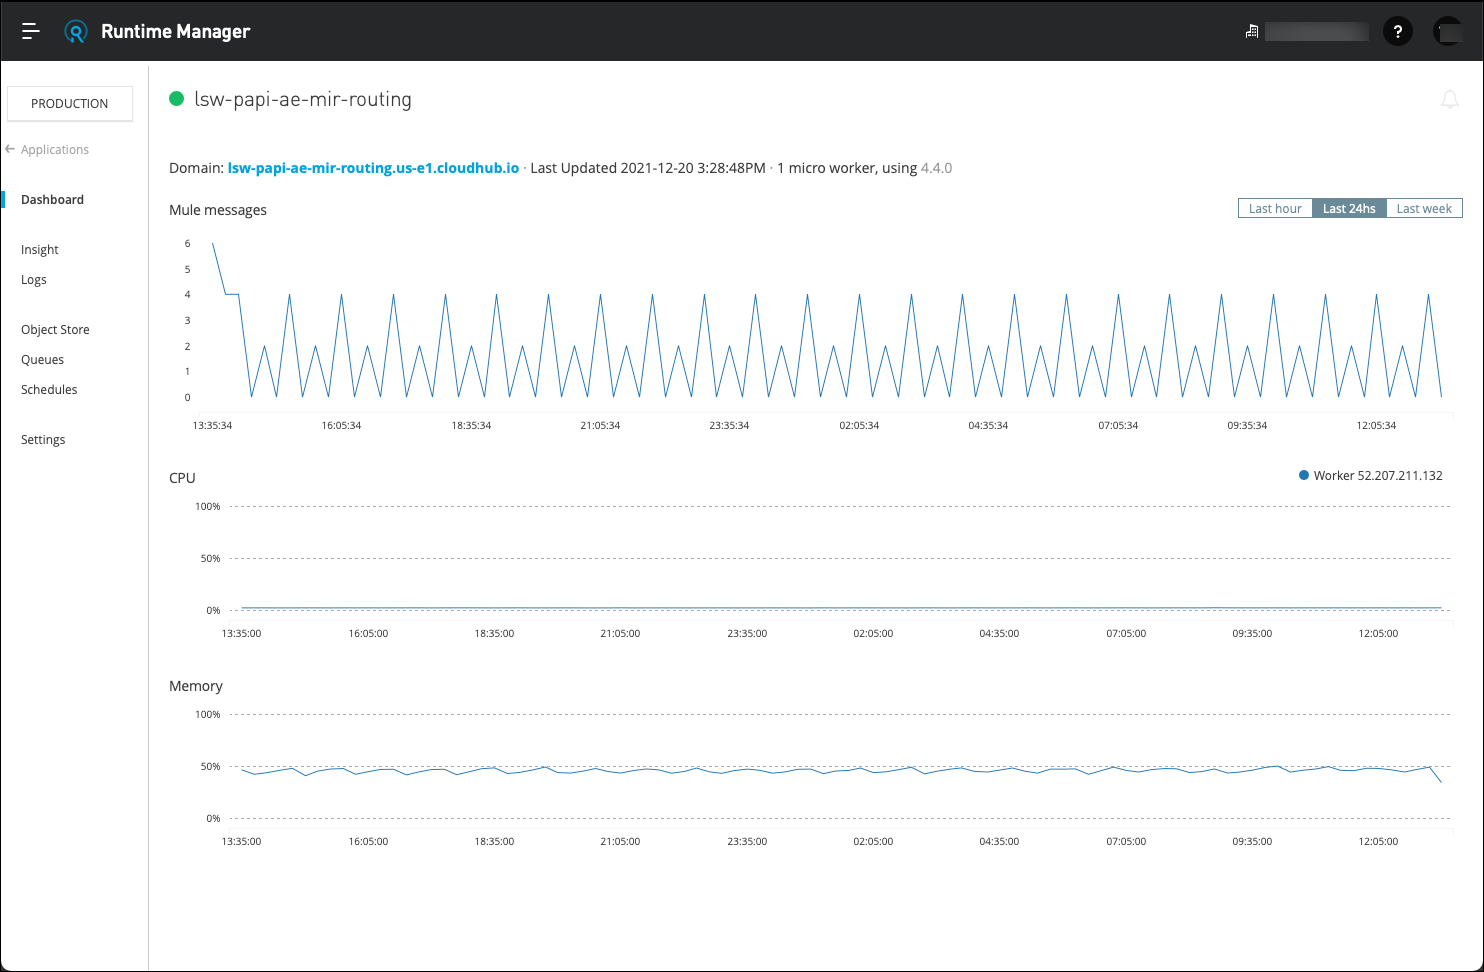
The left side of the page lists several options that are available to allow you to monitor and gather more detail on your API. Click on the Dashboard link. You will be presented with a high level view of the performance of the selected API.
-
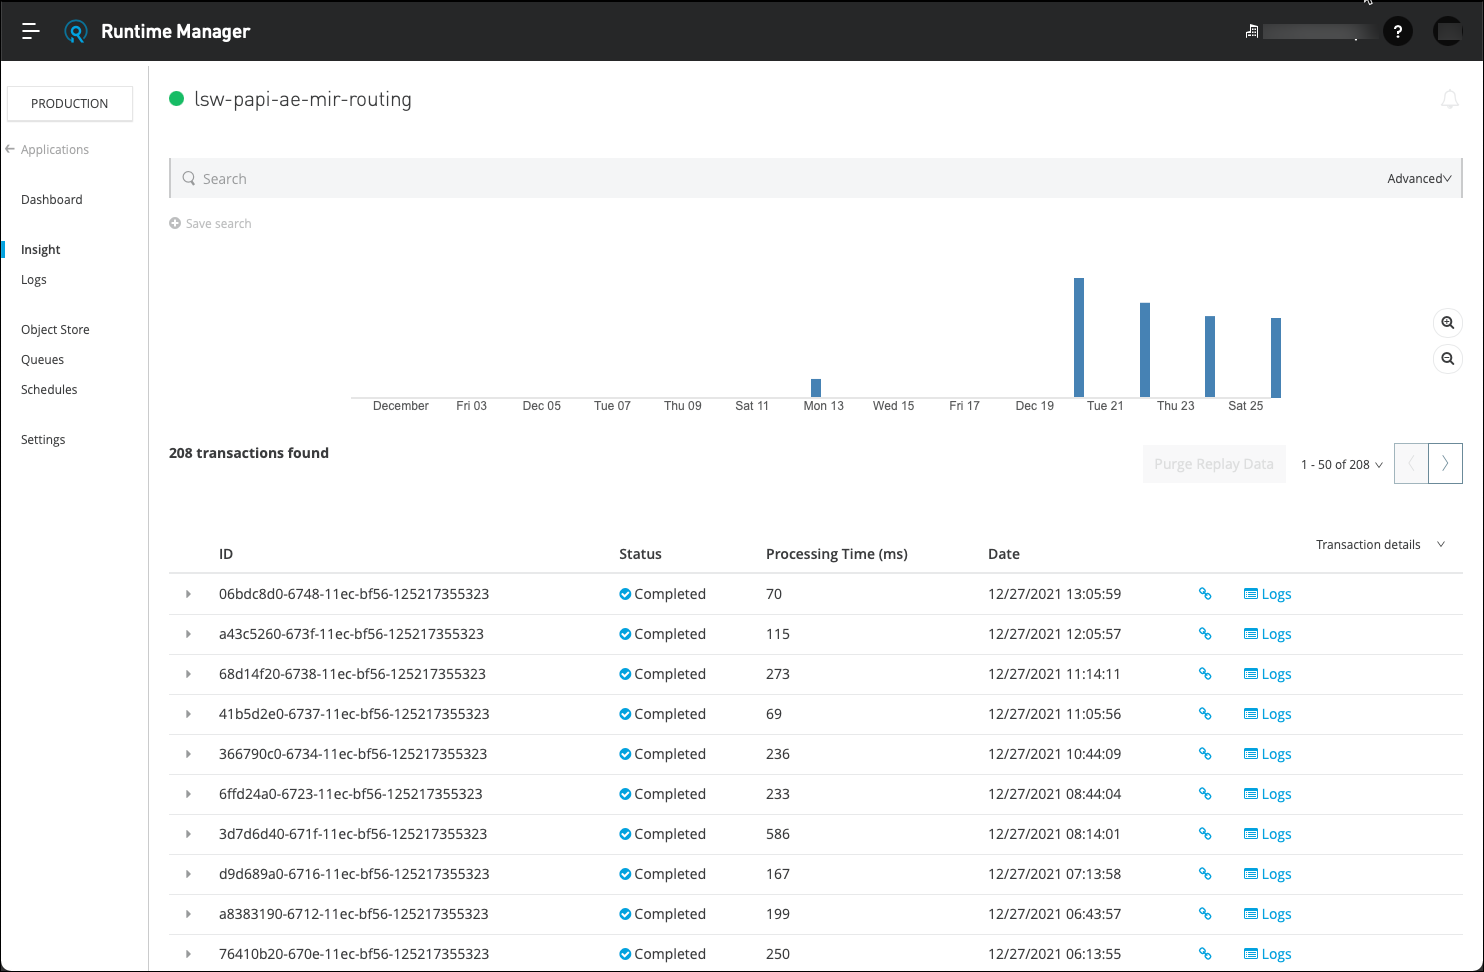
Click on the Insight menu item. A page will be displayed that lists details on each of the API calls that have been processed by this API.
Note: Activating the Insight feature can be controlled on a per-API basis. Due to the overhead that is incurred when collecting this level of detail, it is recommended to only activate Insight when required for troubleshooting or analysis.
-
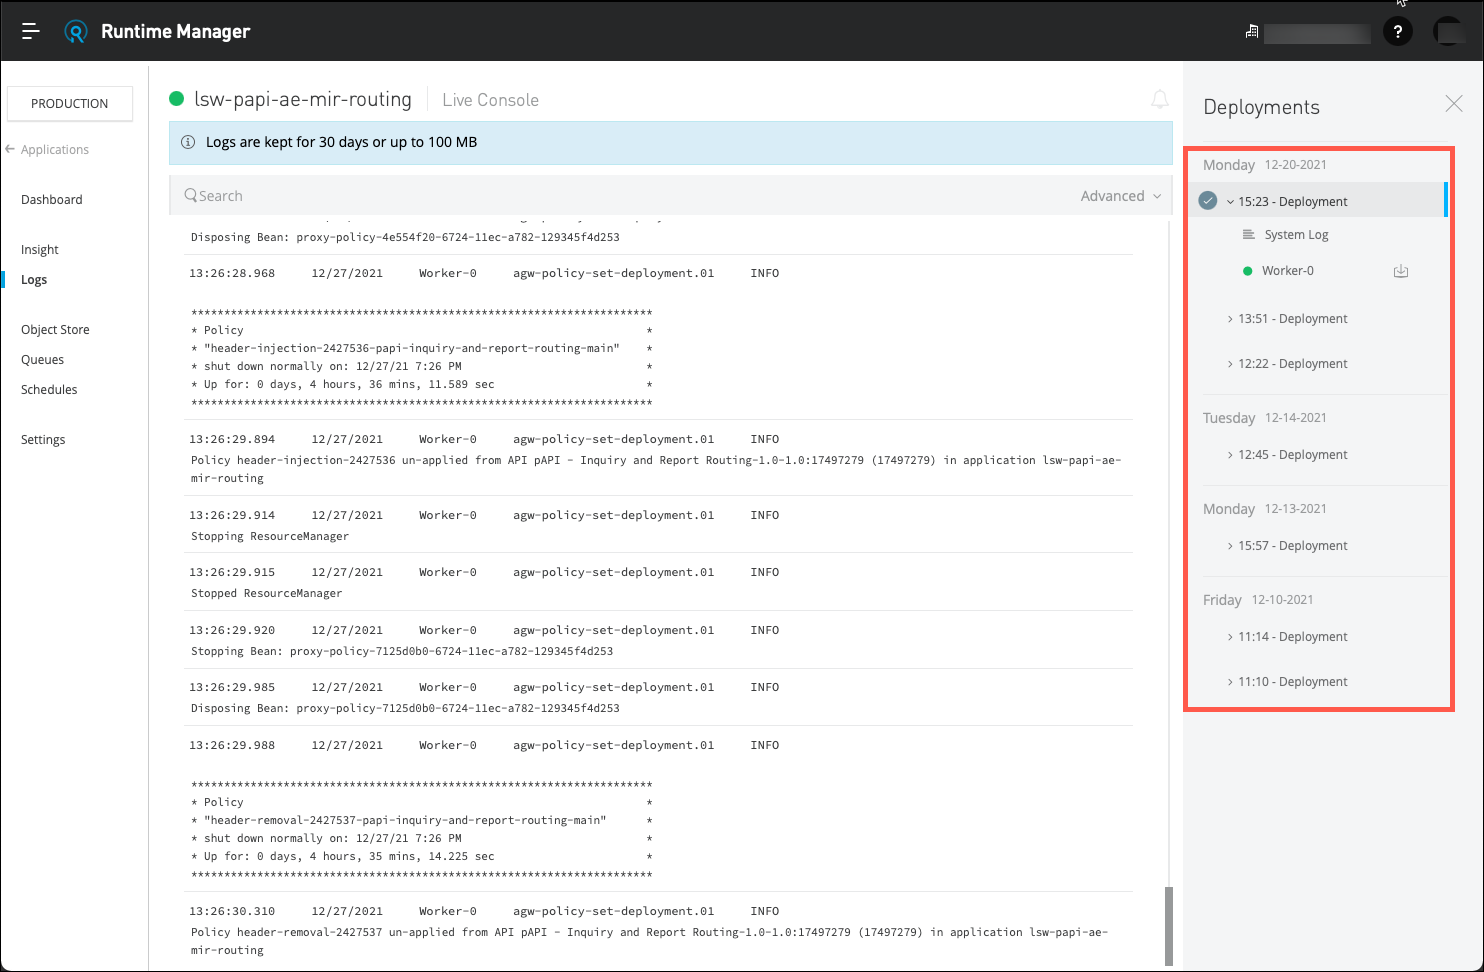
Click on the Logs menu item. Your browser will now display all log data that has been recorded by your API. Note the right side of the page. Depending on your development activity you may see logs from previous deployments of your APIs. You may click on any of the entries to review log data for that instance as well.
-
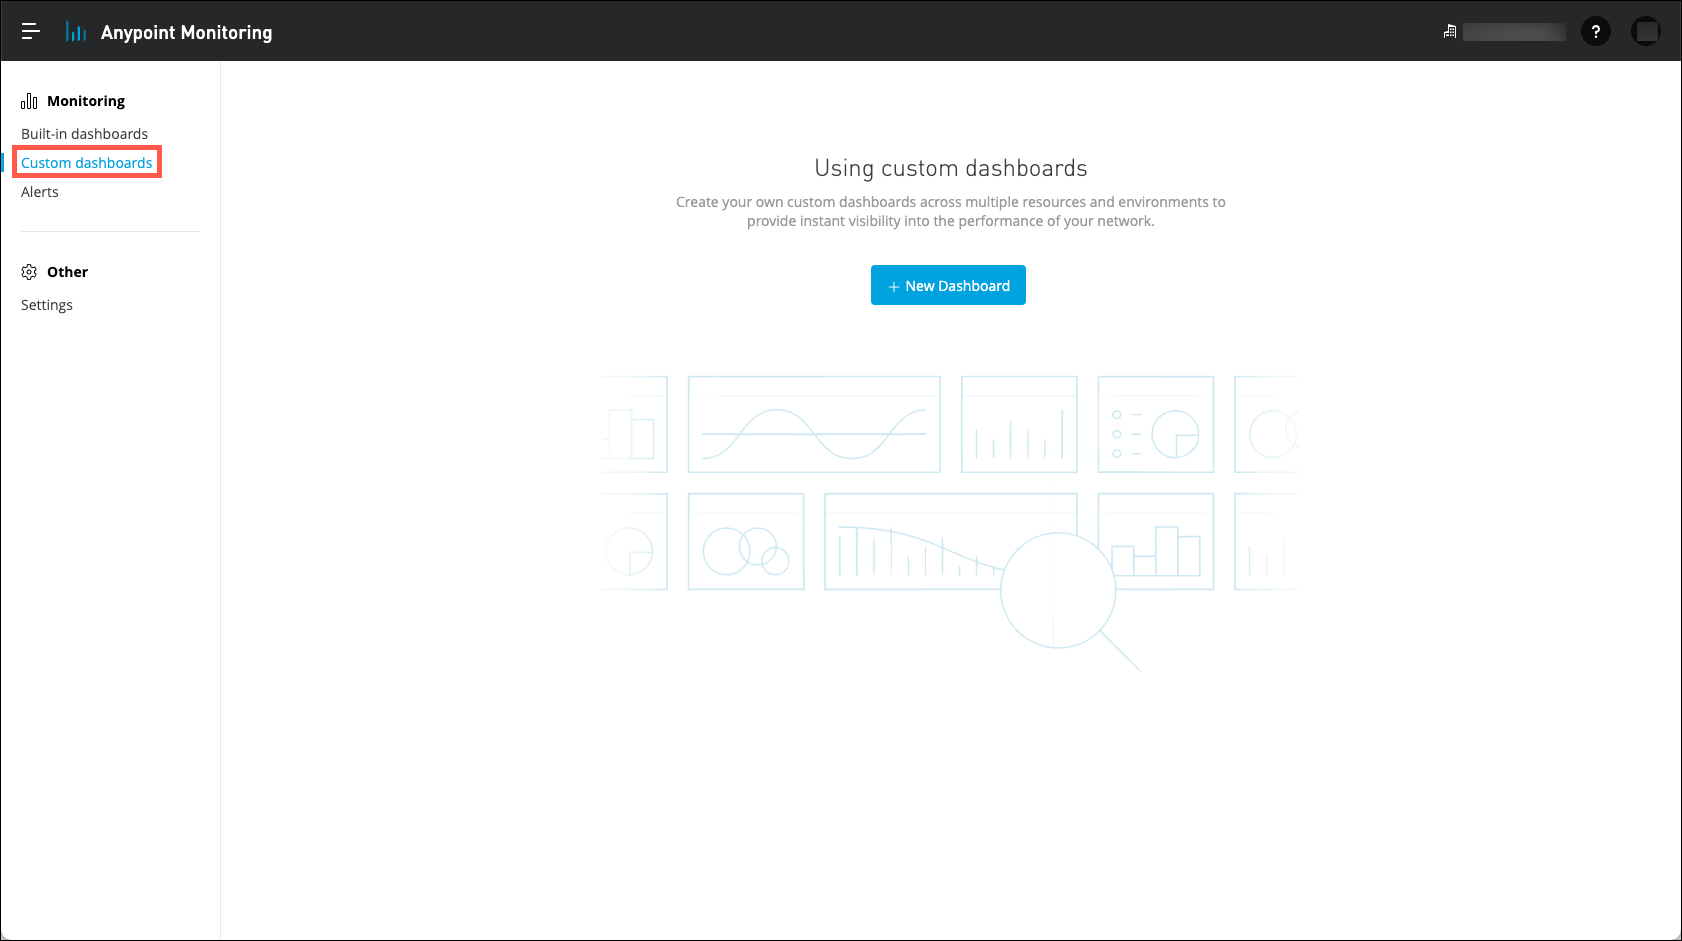
Return to Anypoint Monitoring and then click on the Custom dashboards link.
-
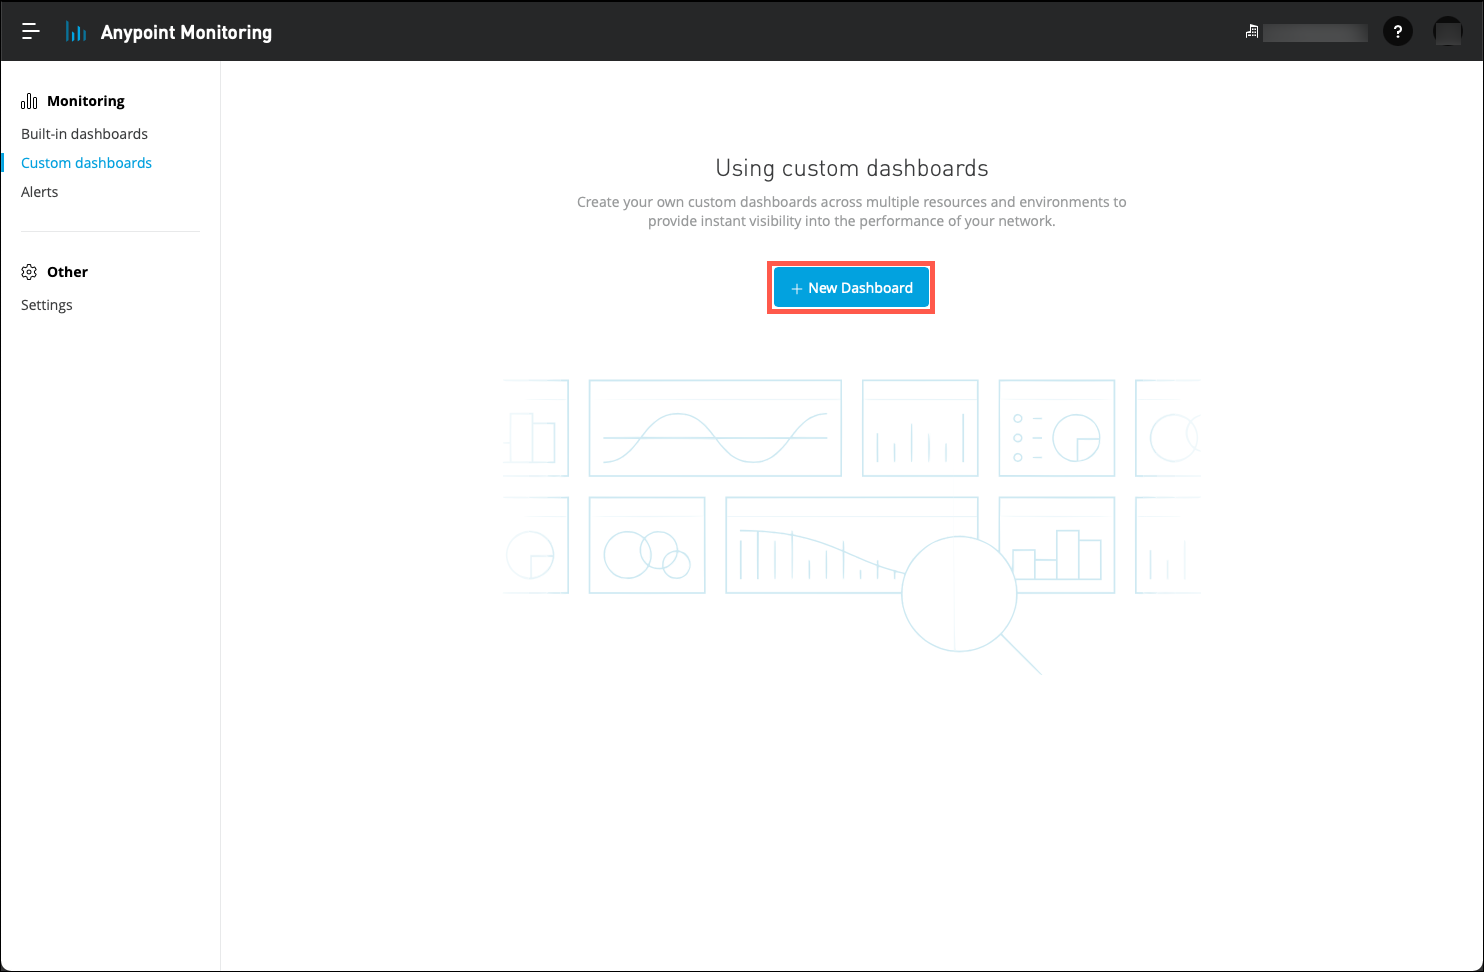
Next, click on the + New Dashboard button.
-
The Built-in dashboards provide a lot of great detail into the health and operation of your APIs. There are times, however, when a custom dashboard would be useful. Showing just the graphs and tables that are of interest to a user is one reason to create a custom dashboard. Being able to include business data along with, or instead of, system data may be of value as well. Developers can create Custom Metrics that can be used to display business data on a custom dashboard.
Note: As you can imagine, not all business data should be visible via a custom dashboard. Thus, explicit steps need to be completed by the developer of an API in order to expose any business data in a dashboard. Refer to the MuleSoft documentation web site for information on configuring Custom Metrics
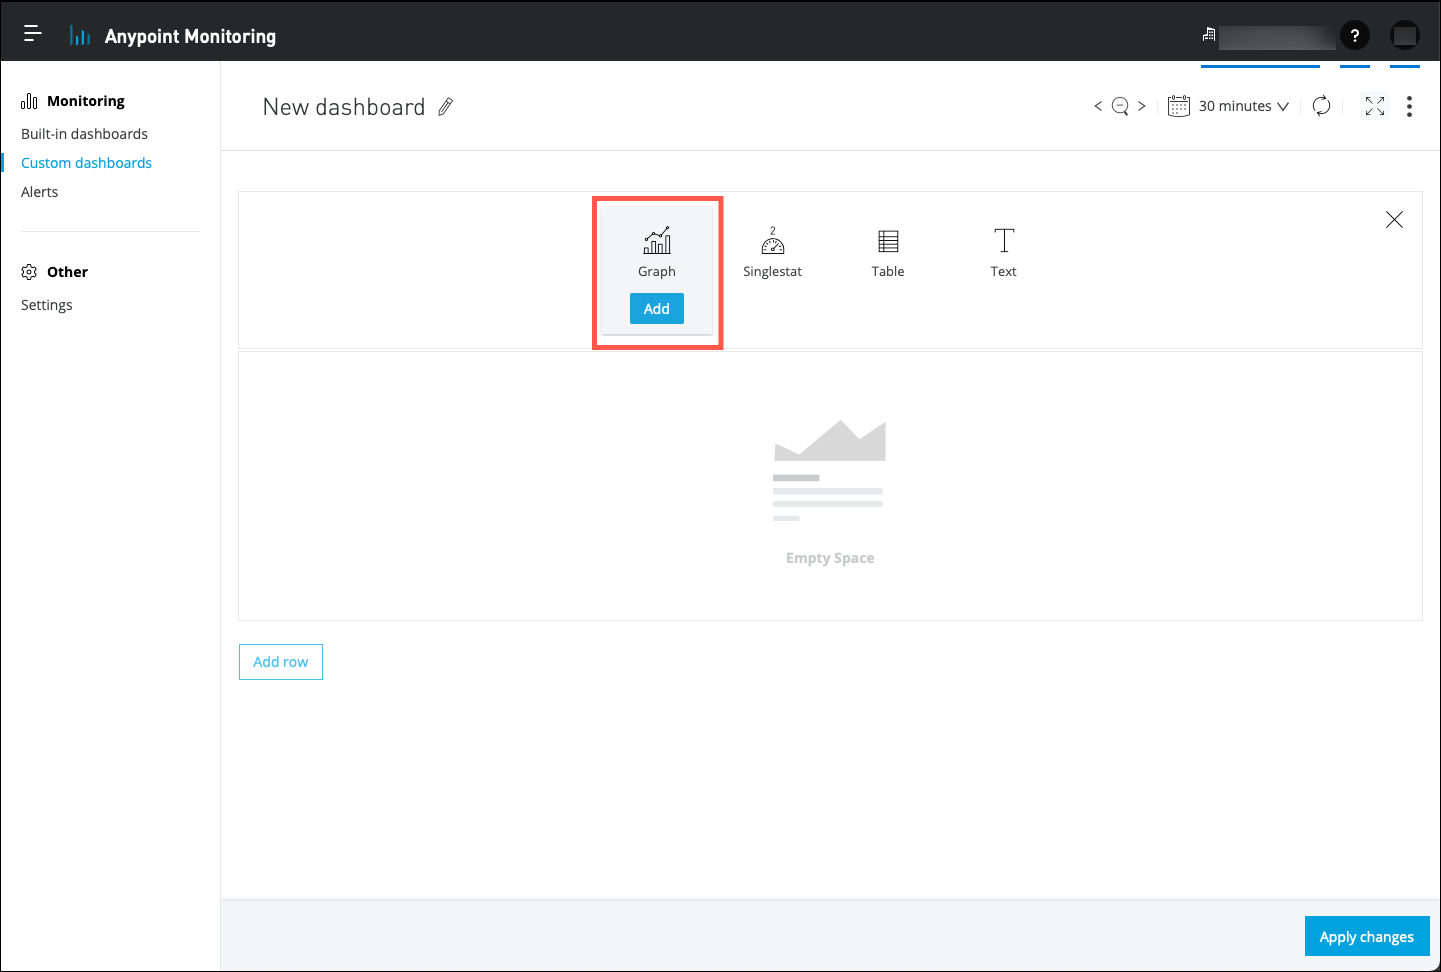
Click on the Add button immediately below the Graph icon.
-
A blank dashboard is now displayed. From this point you can add any number of display widgets to the dashbard. You can also organize the displayed widgets into rows.
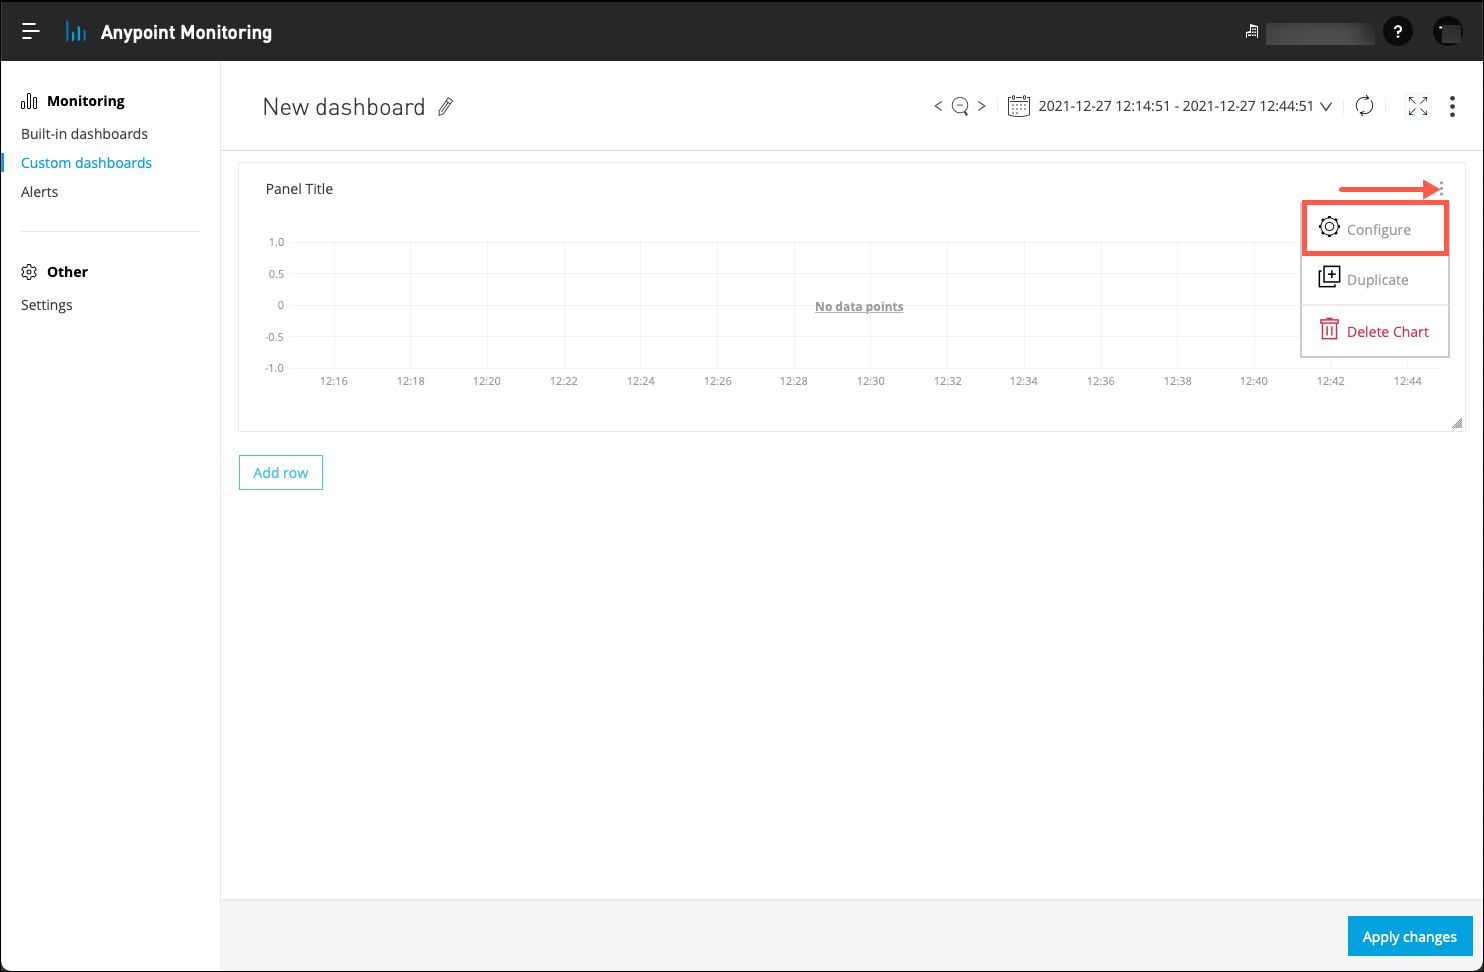
-
Experiment with adding various widgets to the blank dashboard. Note that most of the widgets require you to set properties to be able to display data. Look for and then click on the properties editor link to set the properties for a widget. An example is shown below.
Note: Ensure that you use the Apply Changes button in the lower right portion of the page when you have completed your configuration.

-
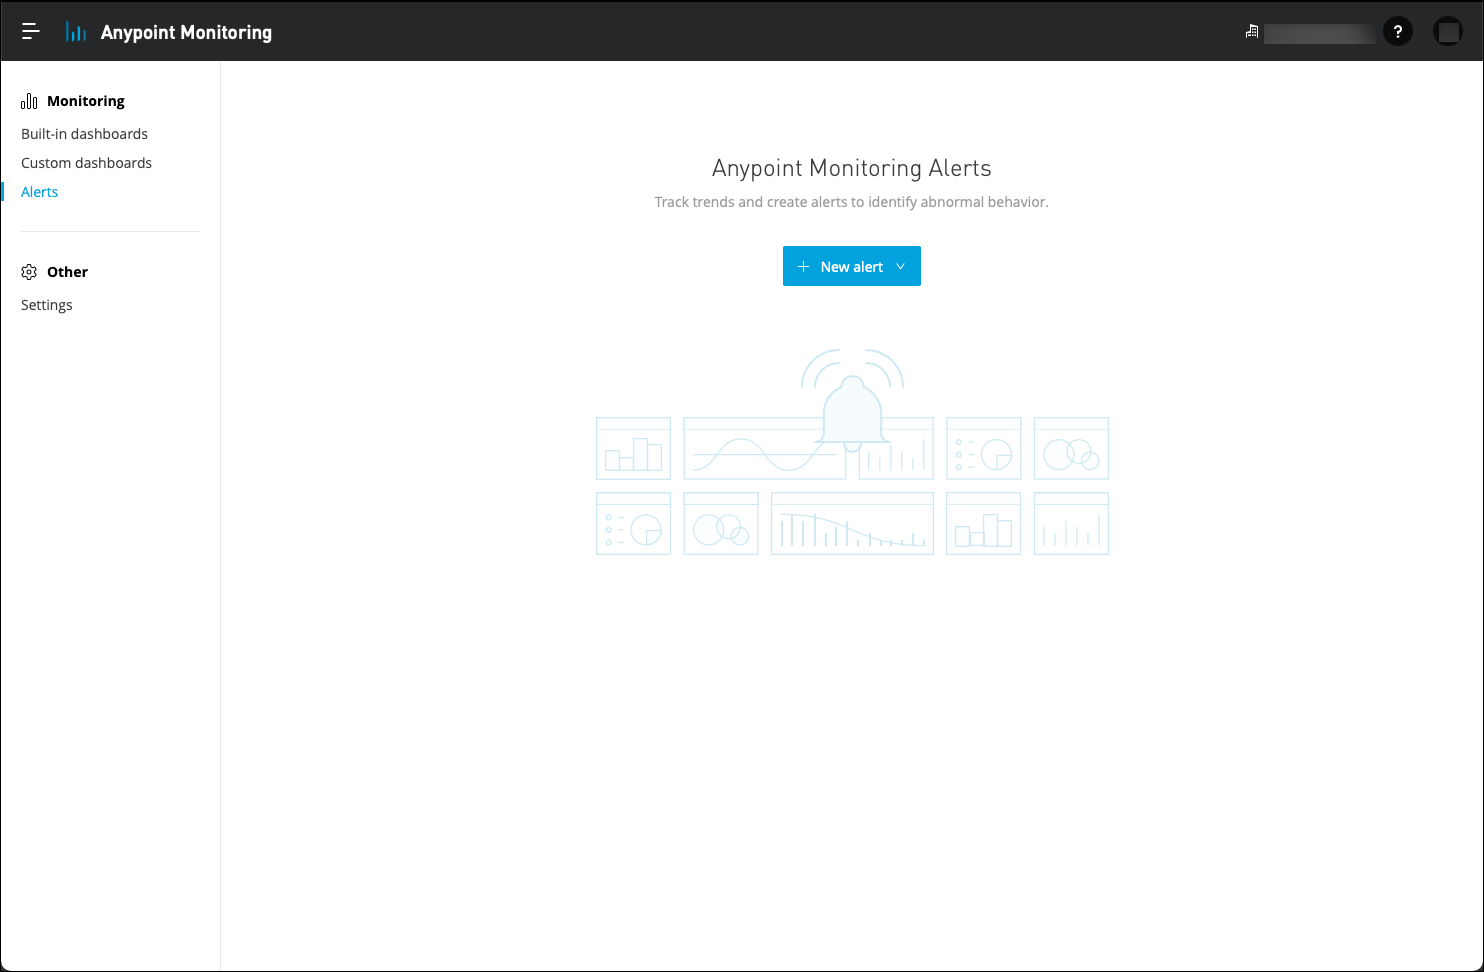
Operating a complex Application Network can demand a great deal of attention to ensure that problems are identified and address as quickly as possible. Anypoint Monitoring provides an alerting capability that will notify operators via email of any out-of-band conditions that may be occuring with an API in the Application Network. Click on the Alerts menu item. Your browser will now display all alerts that has been configured in your Application Network.
-
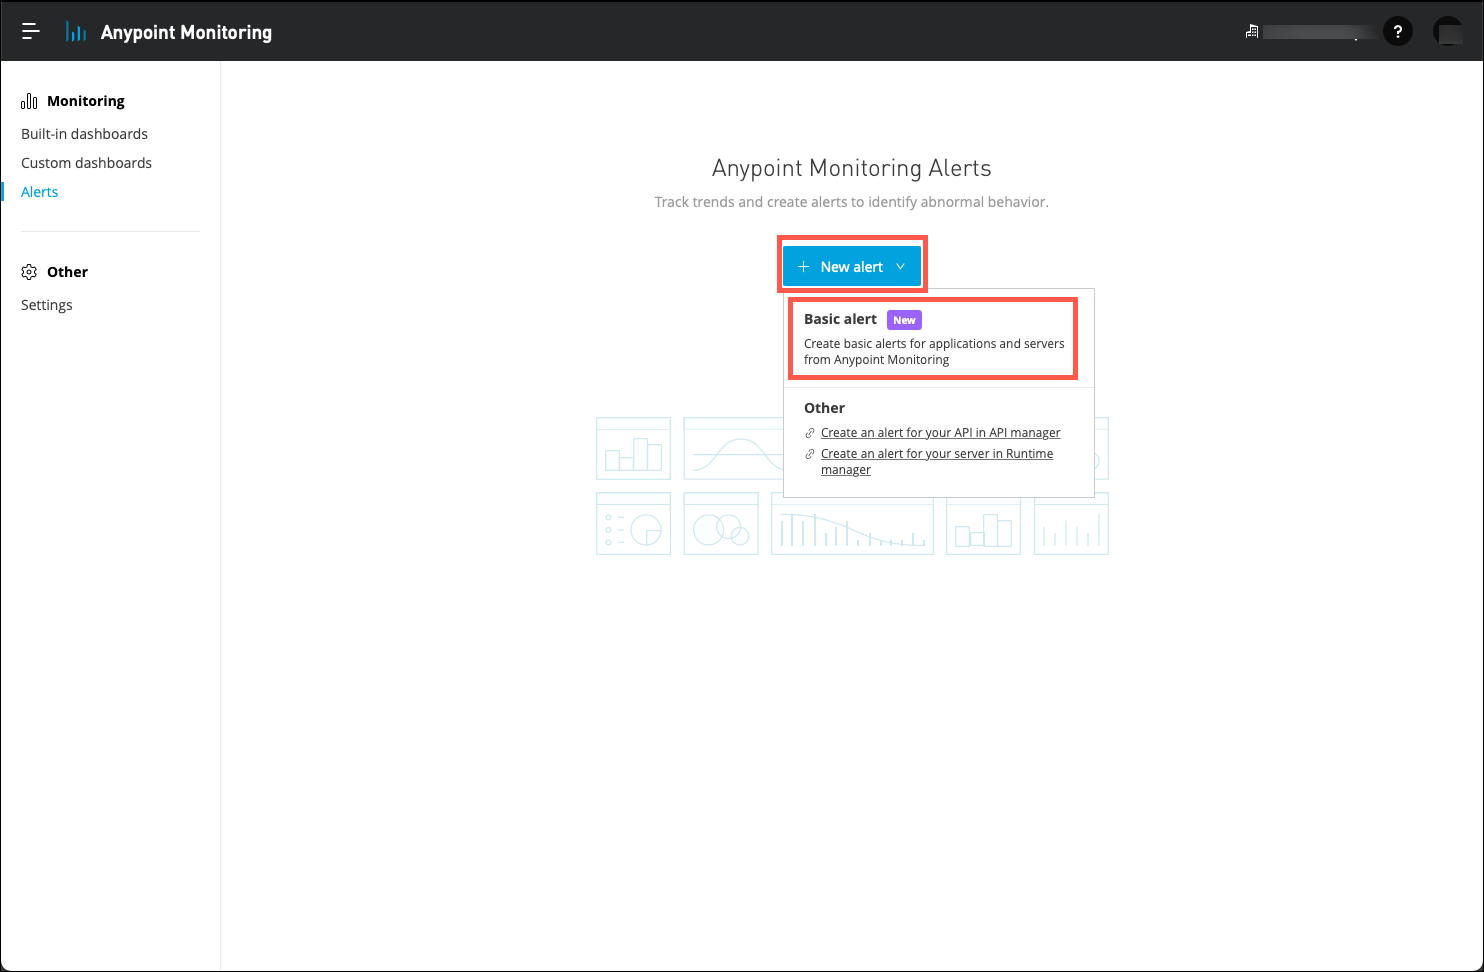
Click on the New alert button. A list of several options will be displayed. Click on the Basic alert menu item.
-
The Add basic alert dialog will appear.
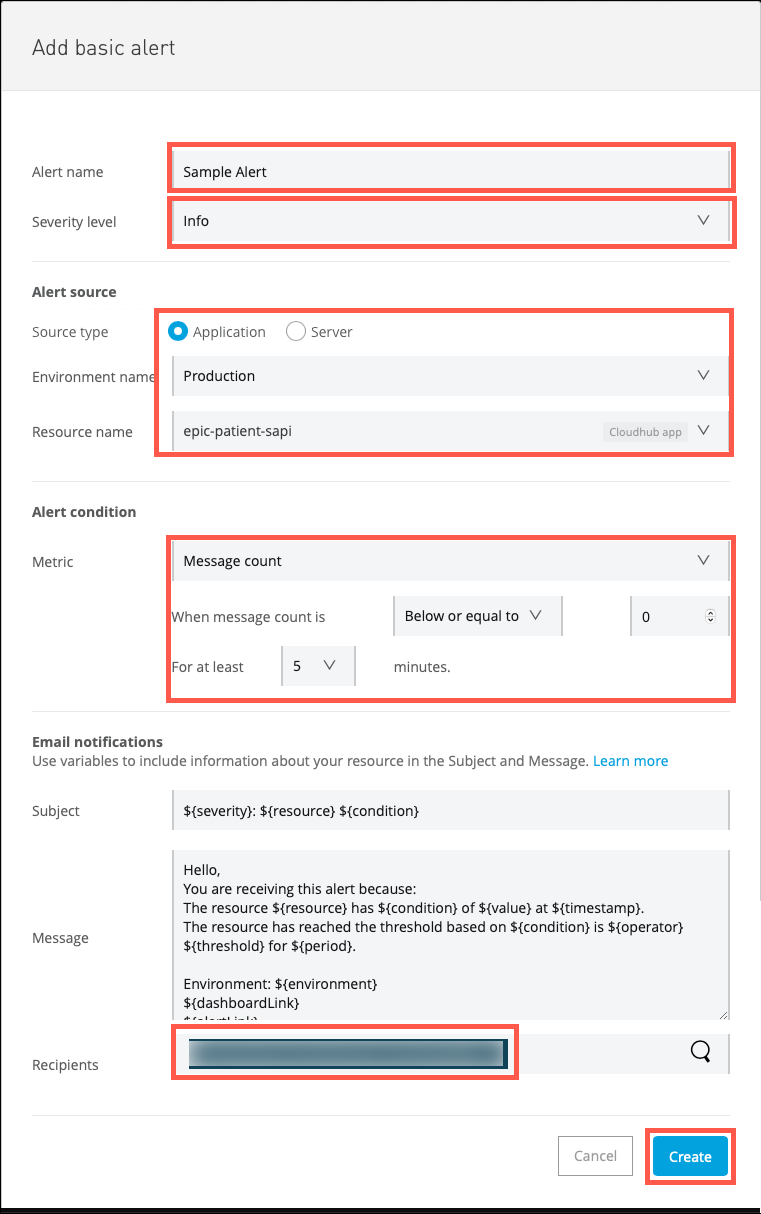
Complete each of the mandatory entries to configure your alert. Note the following:
-
Ensure that you use a unique name for the alert to avoid errors. For example, prefix the alert name with your initials.
-
Alerts may be configured based on an application, server or API configuration.
-
You can configure several Severity levels for your alert.
-
You can configure one or more email recipient for each alert.
Note: This lab exercise has provided a simple introduction to monitoring and alerts. Depending on your Anypoint subcription level, more advanced features such as Functional Monitors are avialable.
-
Summary
You have had an opportunity to review a number of monitoring and troubleshooting tools available with Anypoint Visualizer and Anypoint Monitoring. But, you’ve only scratched the surface in terms of the power of the Anypoint Platform. To learn more go to Further Exploration section to continue your exploration.